

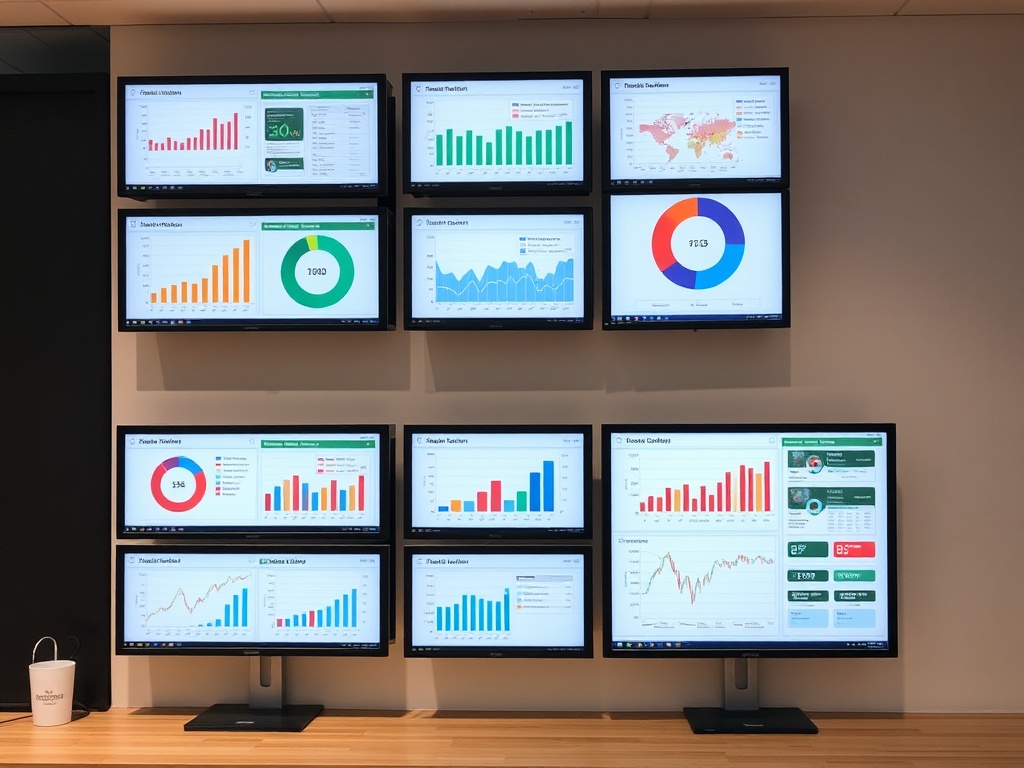
Multi-Engine Market Analysis
The Vitruvian Charting Suite combines multiple analytical engines to reveal the deeper structure of price movement. Instead of relying on a single indicator, Glymear integrates momentum, compression, gravity, exhaustion, and directional bias into one unified analysis system.

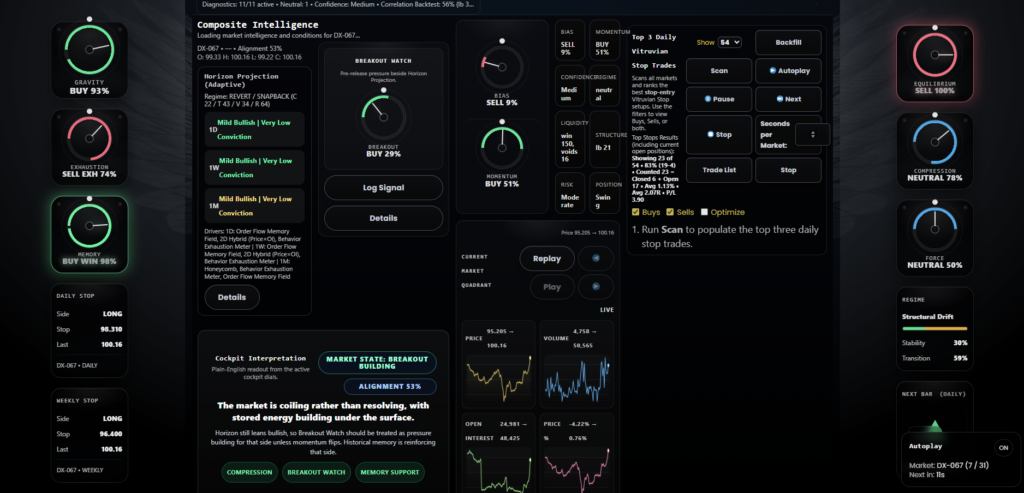
Cockpit Intelligence Dashboard
The Cockpit transforms complex market signals into an intuitive dashboard of precision dials. Each dial represents a key market force, allowing traders to quickly understand pressure, momentum, and potential breakout conditions without digging through dozens of charts.

Clarity Beyond Traditional Charts
Traditional charting platforms focus only on price history. The Vitruvian Charting Suite goes deeper—analyzing structural forces and relationships within the market to reveal patterns, alignment, and emerging opportunities.
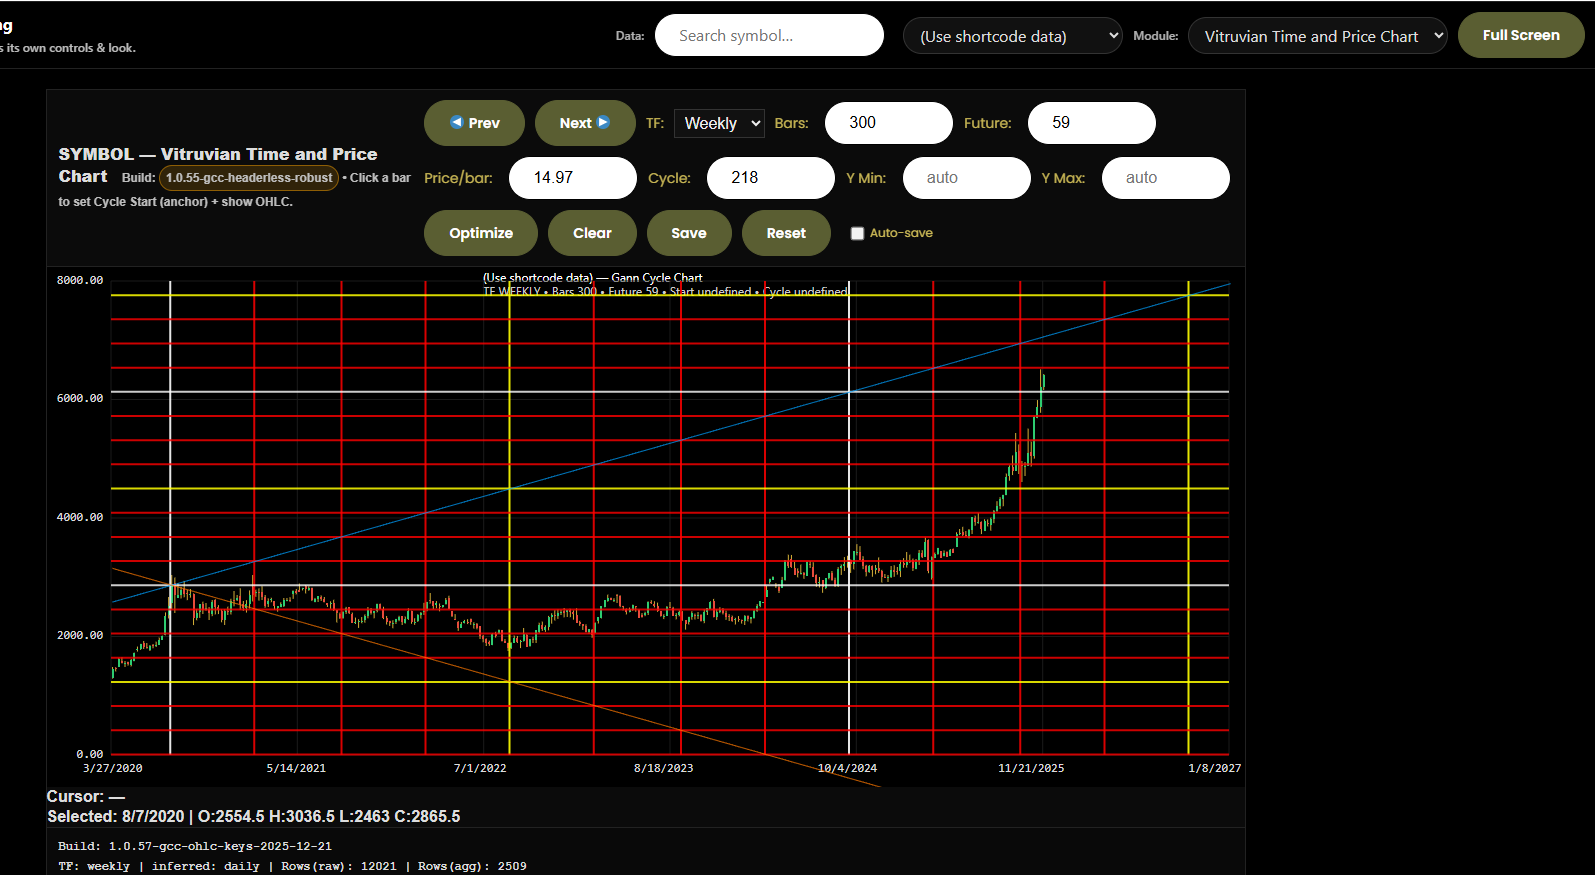
Vitruvian Time & Price Chart Where Time and Price Meet Geometry
By aligning time and price on equal footing, this chart exposes proportional movement and rhythm. It helps you observe balance, imbalance, and transitions—useful for understanding where price is relative to its natural pacing.
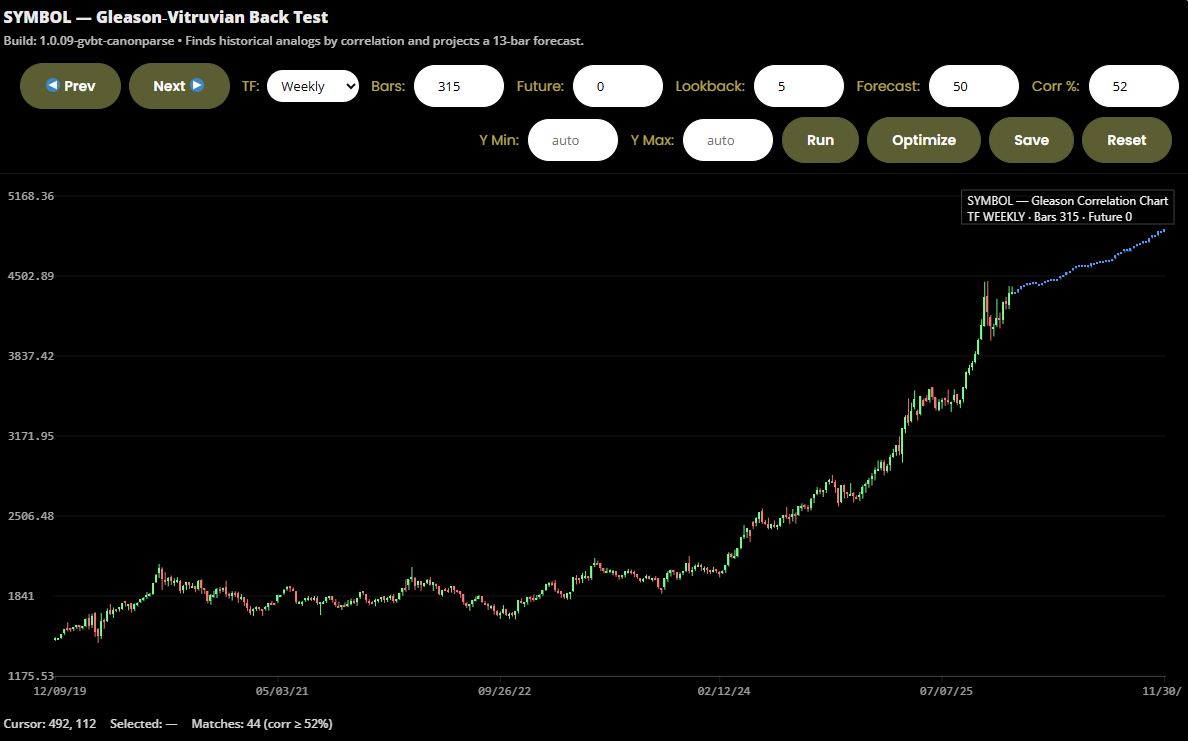
Vitruvian Correlation Chart See When the Market Remembers Itself
This chart identifies historical periods that closely resemble current price behavior and projects how those moments resolved. Rather than predicting, it reveals market memory—allowing you to reflect on how similar conditions have unfolded before.
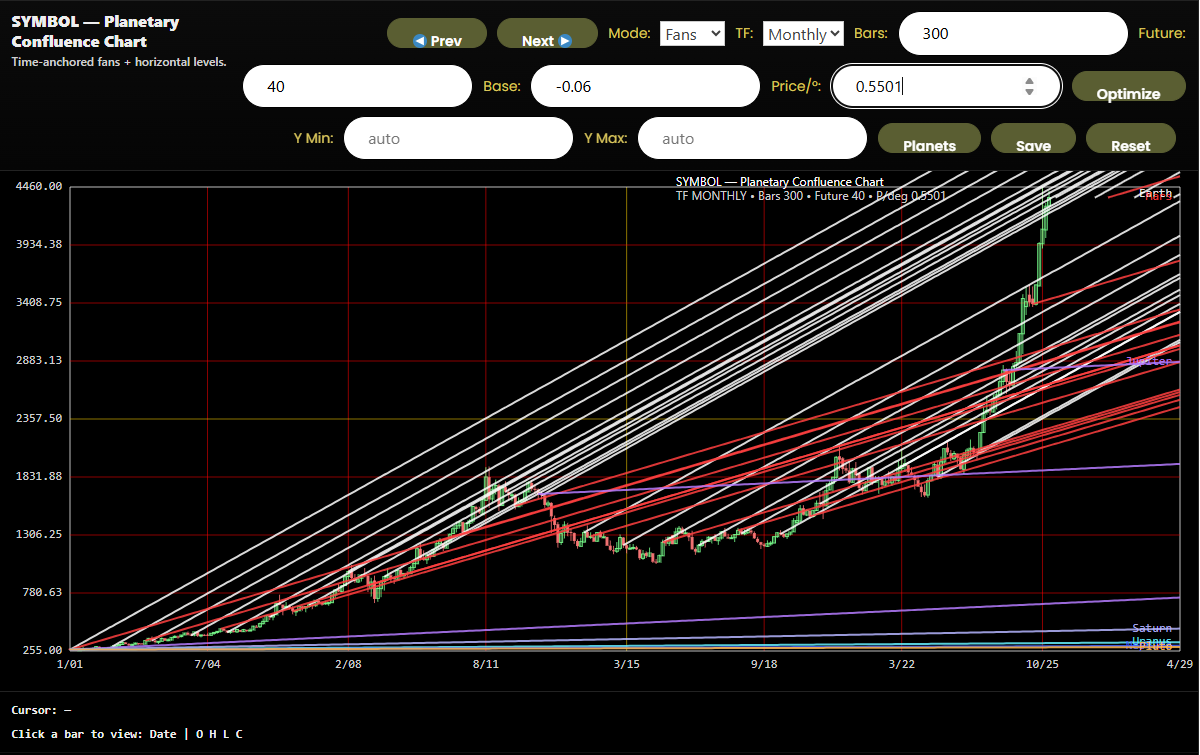
Planetary Confluence Chart Long Cycles, Quiet Influence
This chart layers long-term cyclical references over price, highlighting areas where multiple cycles converge. It’s not about belief—it’s about structure—offering a broader temporal lens for traders who think in weeks, months, and years.
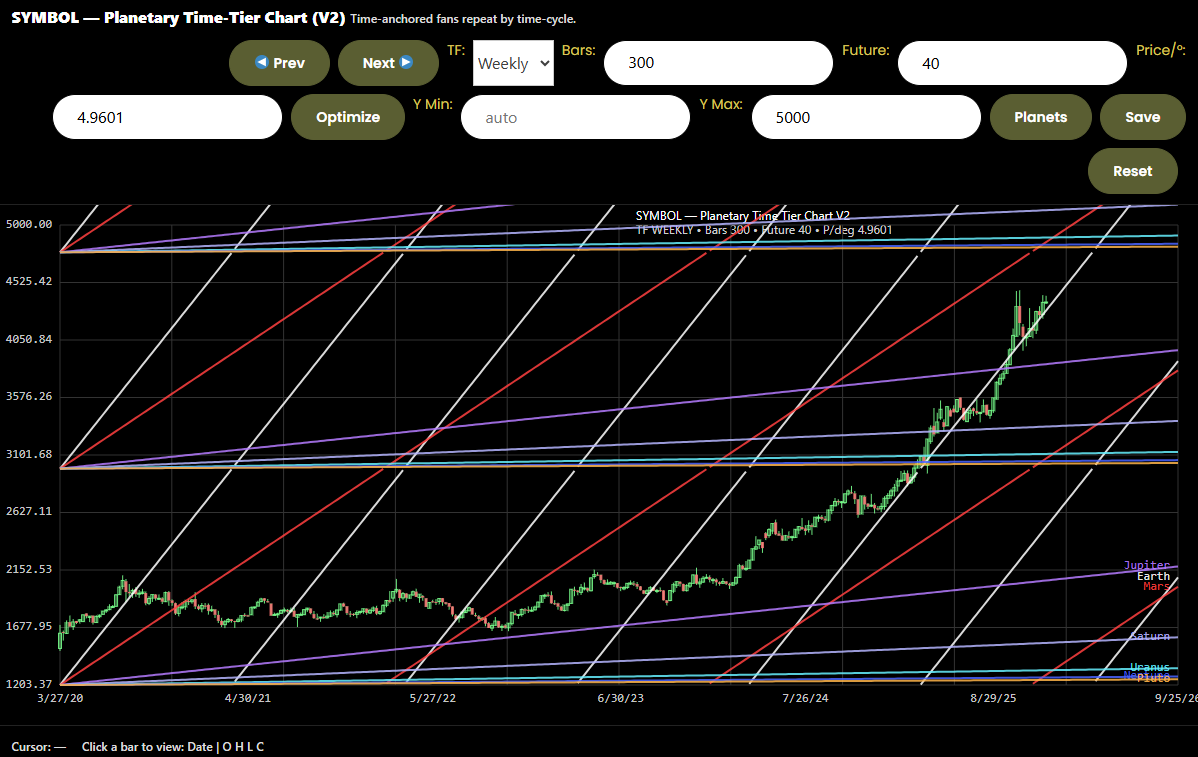
Planetary Time-Tier Chart Markets Move in Layers of Time
Different time cycles repeat at different scales. This chart visualizes those tiers simultaneously, helping you recognize when short-term movement aligns—or conflicts—with longer-term structure.
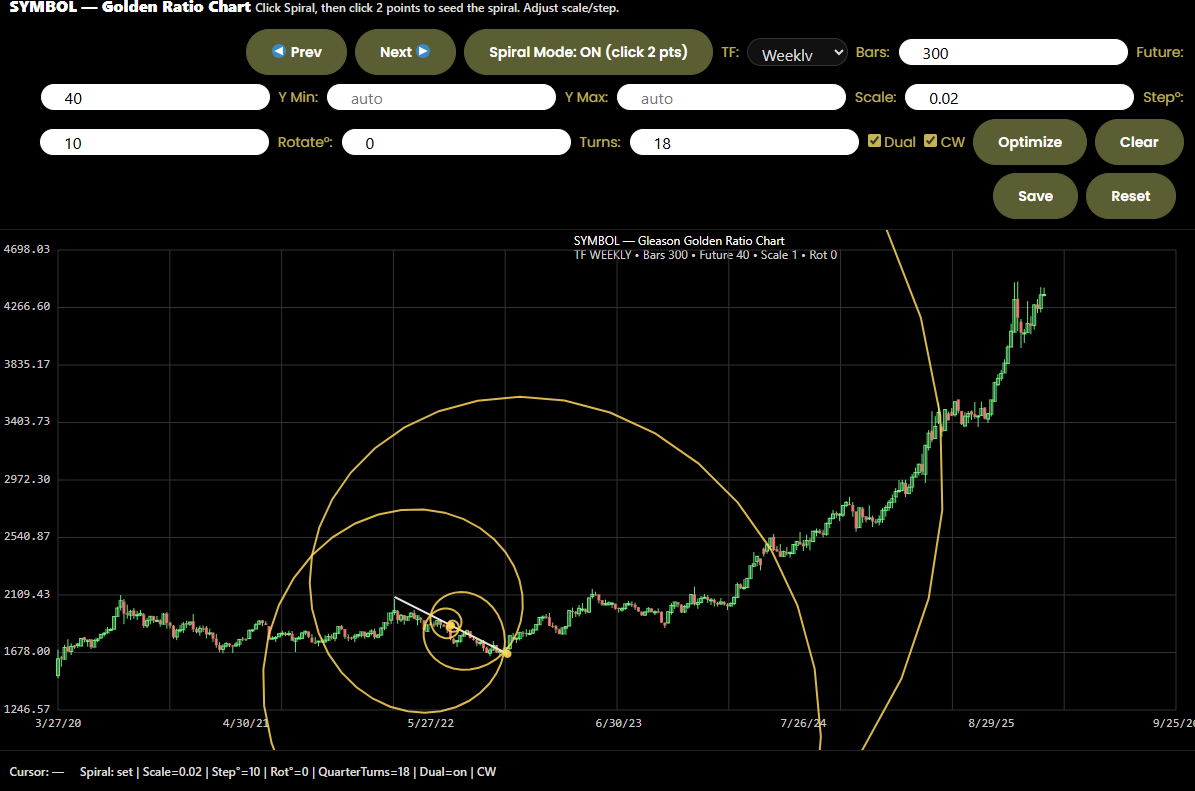
Golden Ratio Spiral Chart Growth, Expansion, and Natural Proportion
Using the golden ratio, this chart maps expansion and contraction in a way that mirrors organic growth. It’s especially useful for identifying exhaustion, compression, and areas where price behavior changes character.
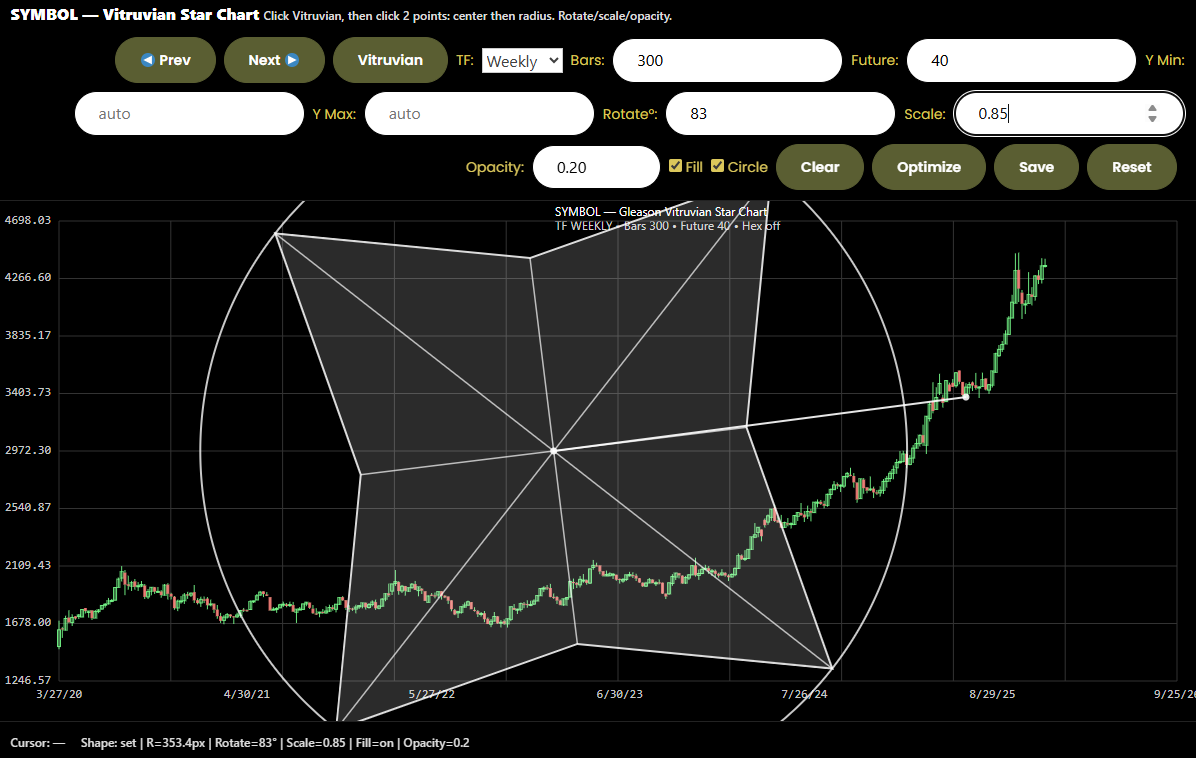
Vitruvian Star Chart Symmetry Reveals Hidden Balance
This chart overlays rotational and radial symmetry on price, exposing structural harmony and distortion. It’s designed to help you see equilibrium—not force it—making it a powerful reflection tool during volatile periods.
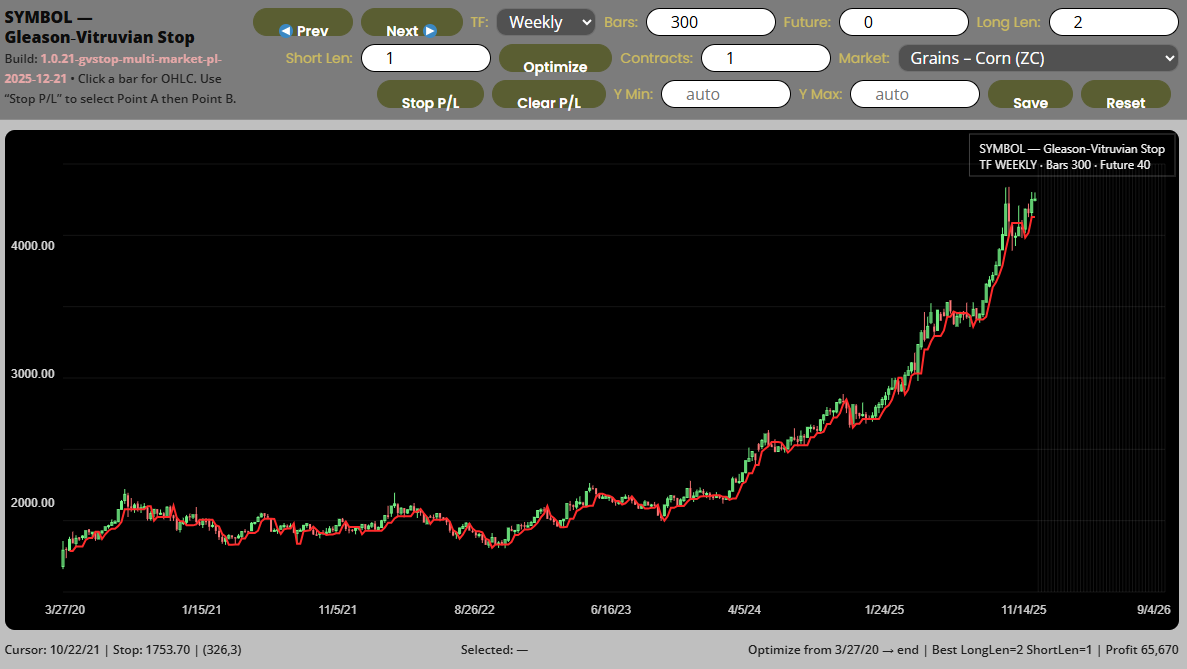
Gleason-Vitruvian Stop A Stop Designed to Follow Structure, Not Emotion
Unlike traditional stops that hug price tightly, this tool respects market geometry and movement. It adapts to structure, helping traders stay aligned with trend while avoiding premature exits driven by noise.
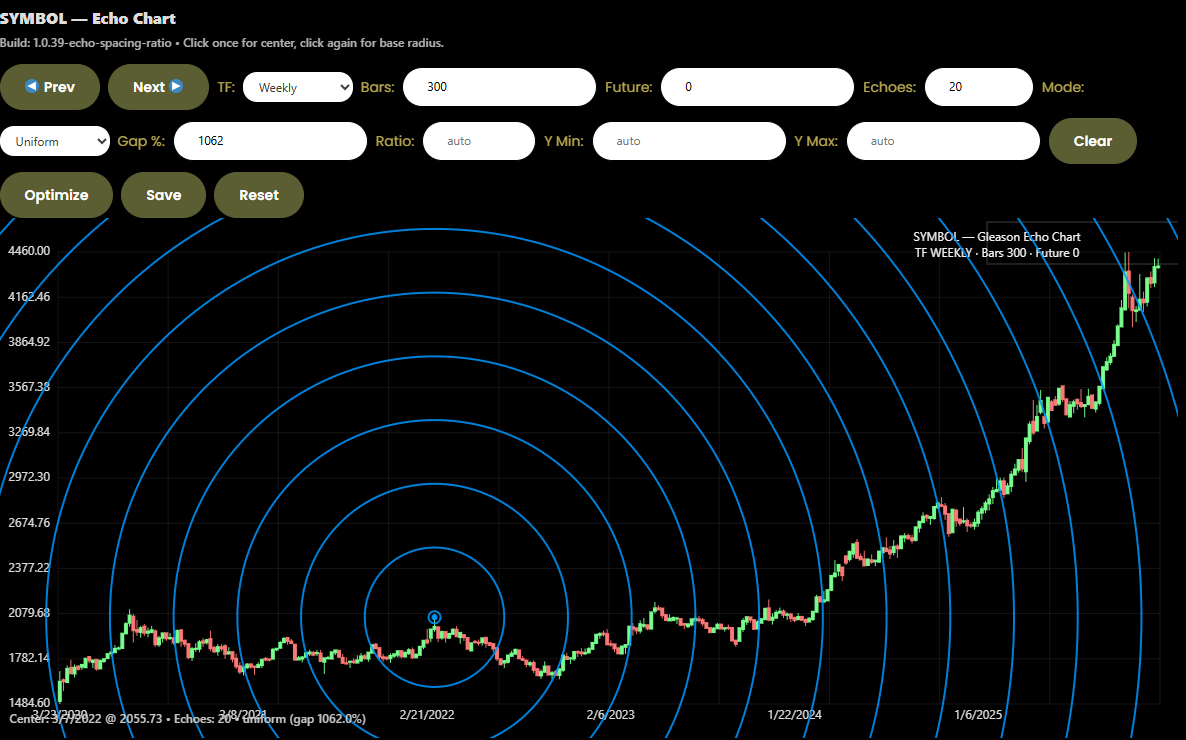
Echo Chart When Price Repeats Its Own Voice
The Echo Chart maps repeating distance and rhythm from a chosen point, allowing you to observe how price “echoes” itself over time. It’s especially effective for understanding cycles, reactions, and behavioral repetition.
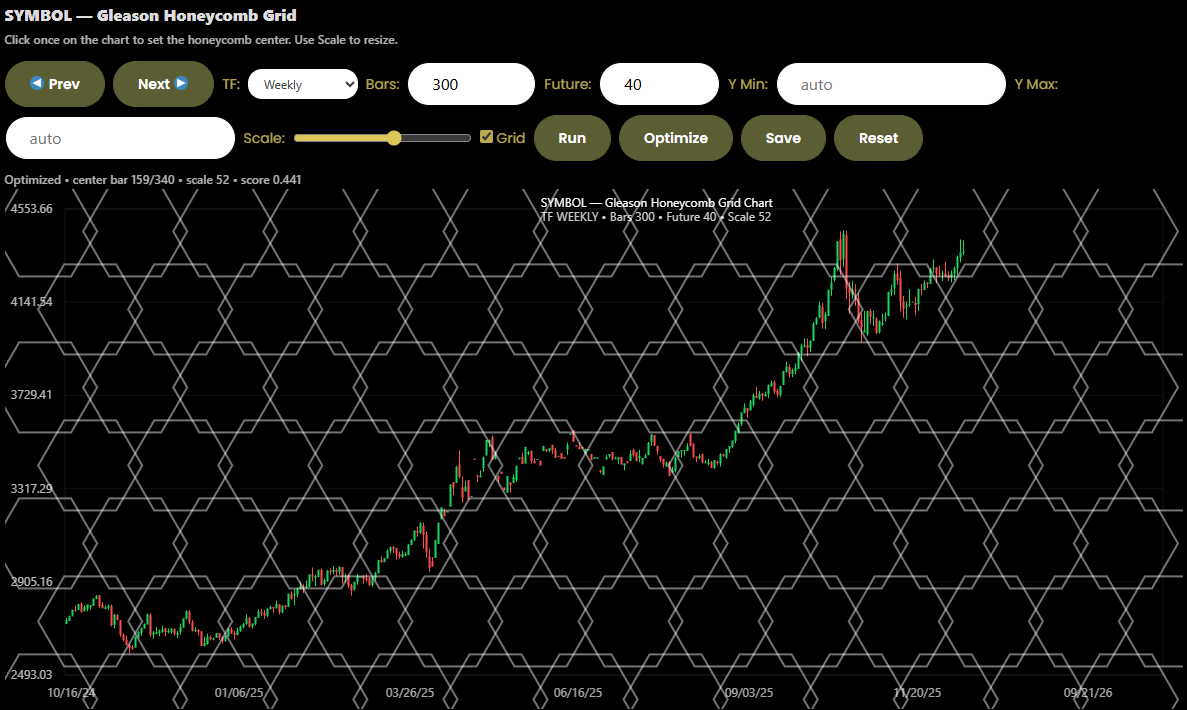
Honeycomb Grid Chart Order Within Apparent Chaos
Markets often move within repeating geometric ranges. The Honeycomb Grid reveals these repeating zones, offering a calm, structured view of price movement without relying on traditional indicators.


Glymear has completely changed how I engage online. The focus on questions and reflection creates a calm, respectful space that encourages deep thinking and genuine connections. I feel more understood and inspired here.

Emma L.
Philosopher and Writer, Reflective Minds Inc.
Since joining Glymear, I've appreciated the platform's emphasis on thoughtful questions over superficial comments. It has enriched my perspective and connected me with like-minded individuals who value insight and respect.

James R.
Researcher, Insightful Connections

a chart of May corn prices